Monitoring Apache2 with Landscape
It is important for most sysadmins to have a clear view of the overall trend in their production system.
Since I work on the Landscape project, I wanted to use it's nifty custom graphing feature to get an understanding of the general trends of apache connections for this blog.
Enter custom graphs
Custom monitoring graph scripts are Landscape's solution to arbitrary trend graphing. You can create one by navigating to "Custom graphs" from your main account page:
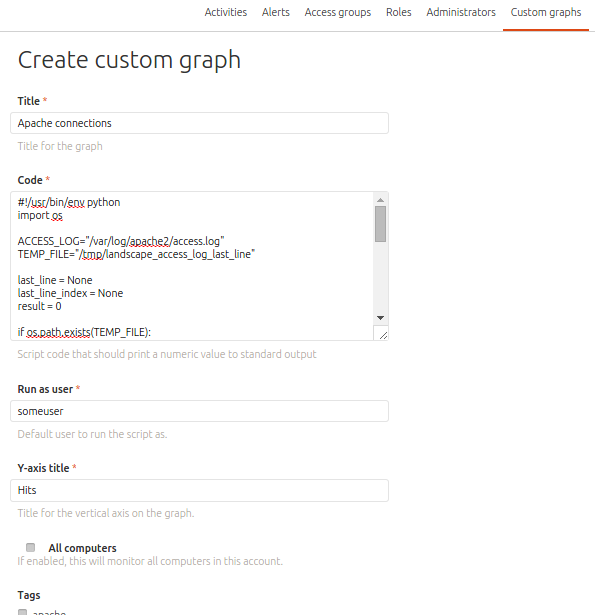
Basically, it's a script that is expected to return a numeric value to standard out, that Landscape will run every 5 minutes and plot the results in the monitoring tab of your account.
Simple as pie!
Writing a script to monitor apache connections
The following script, written in Python, should allow you to plot the number of connections to your website with minimal changes: adapt the location of access.log to match your site, and make sure the TEMP_FILE path is unique per machine.
#!/usr/bin/env python
import os

ACCESS_LOG="/var/log/apache2/access.log"  # Adapt this to your needs
TEMP_FILE="/tmp/apache_last_line_reqs"  # This should be unique per machine

last_line = None
last_line_index = None
result = 0

if os.path.exists(TEMP_FILE):
    with open(TEMP_FILE, "r") as line_file:
        last_line = line_file.read()

logs = []
with open(ACCESS_LOG, "r") as log_file:
    logs = log_file.readlines()

if last_line in logs:
    last_line_index = logs.index(last_line)

if last_line_index and last_line_index != len(logs) -1:
    new_logs = logs[last_line_index+1:]
    result = len(new_logs)

# Write the last line we saw in the special file for next run.
with open(TEMP_FILE, "w") as line_file:
    line_file.write(logs[-1])

print result
Landscape will take care of distributing this to your machines automatically, and will start gathering results for you.
Hope this helps!